





Track translation quality. Prove AI ROI
See translation quality, review effort, and AI effectiveness across every project or task — one workspace analytics view to replace your spreadsheets.
Trusted by 1 million users across 3,000+ companies. From scale-ups to the Forbes Global 2000.
Give leadership the numbers they actually want to see
The #1 challenge when it comes to localization is proving ROI to leadership*. Lokalise Analytics gives you an up to date view of translation quality, task performance, usage, and review effort to justify the investment and make smarter review decisions.
* Source: Nimdzi, What Localization Buyers Really Want, 2025
Acceptance rates
see how often AI translations are accepted without edits.
Post-edit rate
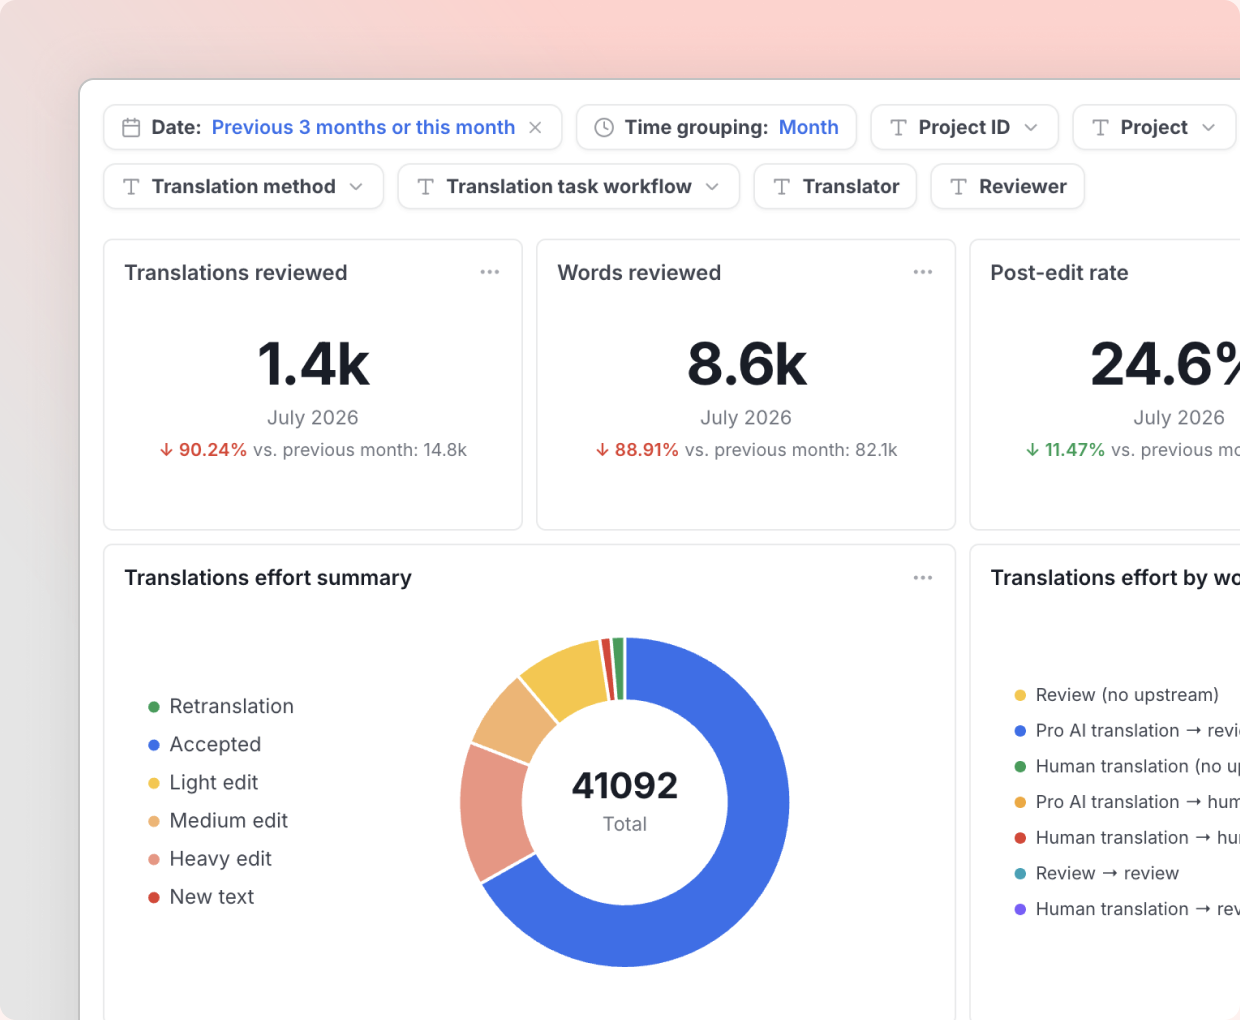
evaluate the quality of your translations by how often they need edits
Edit effort breakdown
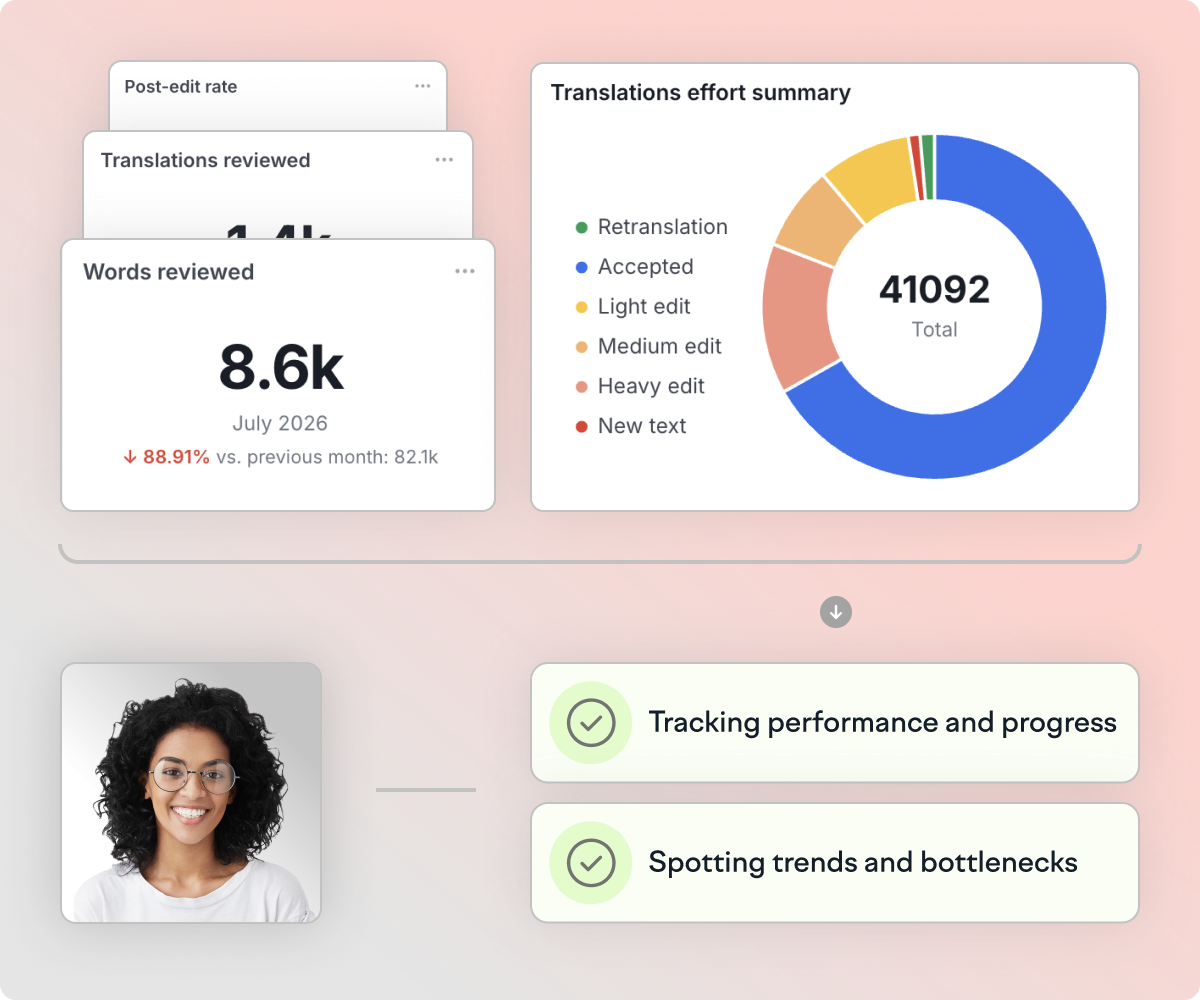
track light, medium, and heavy edits per contributor/review to understand where human touch adds the most value
Language-level evaluation
compare quality performance across your target languages
Task quality by project
identify which projects produce the best results and why
AI scoring insights
measure AI translation quality across languages and projects
Acceptance rates
see how often AI translations are accepted without edits.
Post-edit rate
evaluate the quality of your translations by how often they need edits
Edit effort breakdown
track light, medium, and heavy edits per contributor/review to understand where human touch adds the most value
Language-level evaluation
compare quality performance across your target languages
Task quality by project
identify which projects produce the best results and why
AI scoring insights
measure AI translation quality across languages and projects
How Lokalise Analytics works for translation

FAQs
What is Lokalise Analytics, and how is it different from project-level statistics?
Lokalise Analytics is a cross-project reporting feature that gives localization managers a unified view of usage, translation volume, quality, and contributor performance across their entire Lokalise workspace. Unlike project-level statistics (which shows data for one project at a time) Analytics aggregates insights from all projects into a single set of dashboards, so you can track trends and make decisions without maintaining spreadsheets or manual reports.
Which Lokalise plans include Analytics?
All Lokalise plans (including the free trial) include the Usage, Tasks, and Translation Quality dashboards. Enterprise plans also include Advanced Analytics, which adds project-level filters and downloadable task detail tables for teams managing complex, multi-vendor localization programs.
How often is Analytics data updated?
Analytics data is updated once every 24 hours. It is designed for trend analysis, resource planning, and performance reporting over time rather than real-time monitoring.
What dashboards are available in Lokalise Analytics?
Lokalise Analytics includes four dashboards: Usage (processed words, and OTA delivery), Tasks (contributor performance, turnaround times, and workload distribution), Translation Quality (acceptance rates, edit effort, and language-level evaluation and AI scoring insights) which provides an aggregate AI quality scoring table for a high-level view of AI translation performance.
Can I share Analytics data with my team or leadership?
Yes. You can copy a shareable filter URL for any dashboard view and send it directly to teammates or stakeholders. You can also export detailed CSV reports enriched with translation memory and contributor-level data, or share preconfigured high-level views with executives who want results without the raw data.
Does Analytics track AI translation quality?
Yes. The Translation Quality dashboard shows AI translation acceptance rates, edit effort broken down by light, medium, and heavy edits per contributor, average edit scores across languages and projects, and language-level quality evaluation. This data helps you measure where AI translation performs well and where human review adds the most value.
Start making data-driven localization decisions
Replace spreadsheets, guesswork, and manual reports with a single source of truth for your localization program. Try Lokalise Analytics today.
Keep learning
Case studies

Behind the scenes of localization with one of Europe’s leading digital health providers
Read more Case studiesSupport
Company
Localization workflow for your web and mobile apps, games and digital content.
©2017-2026
All Rights Reserved.