Why localization analytics matters
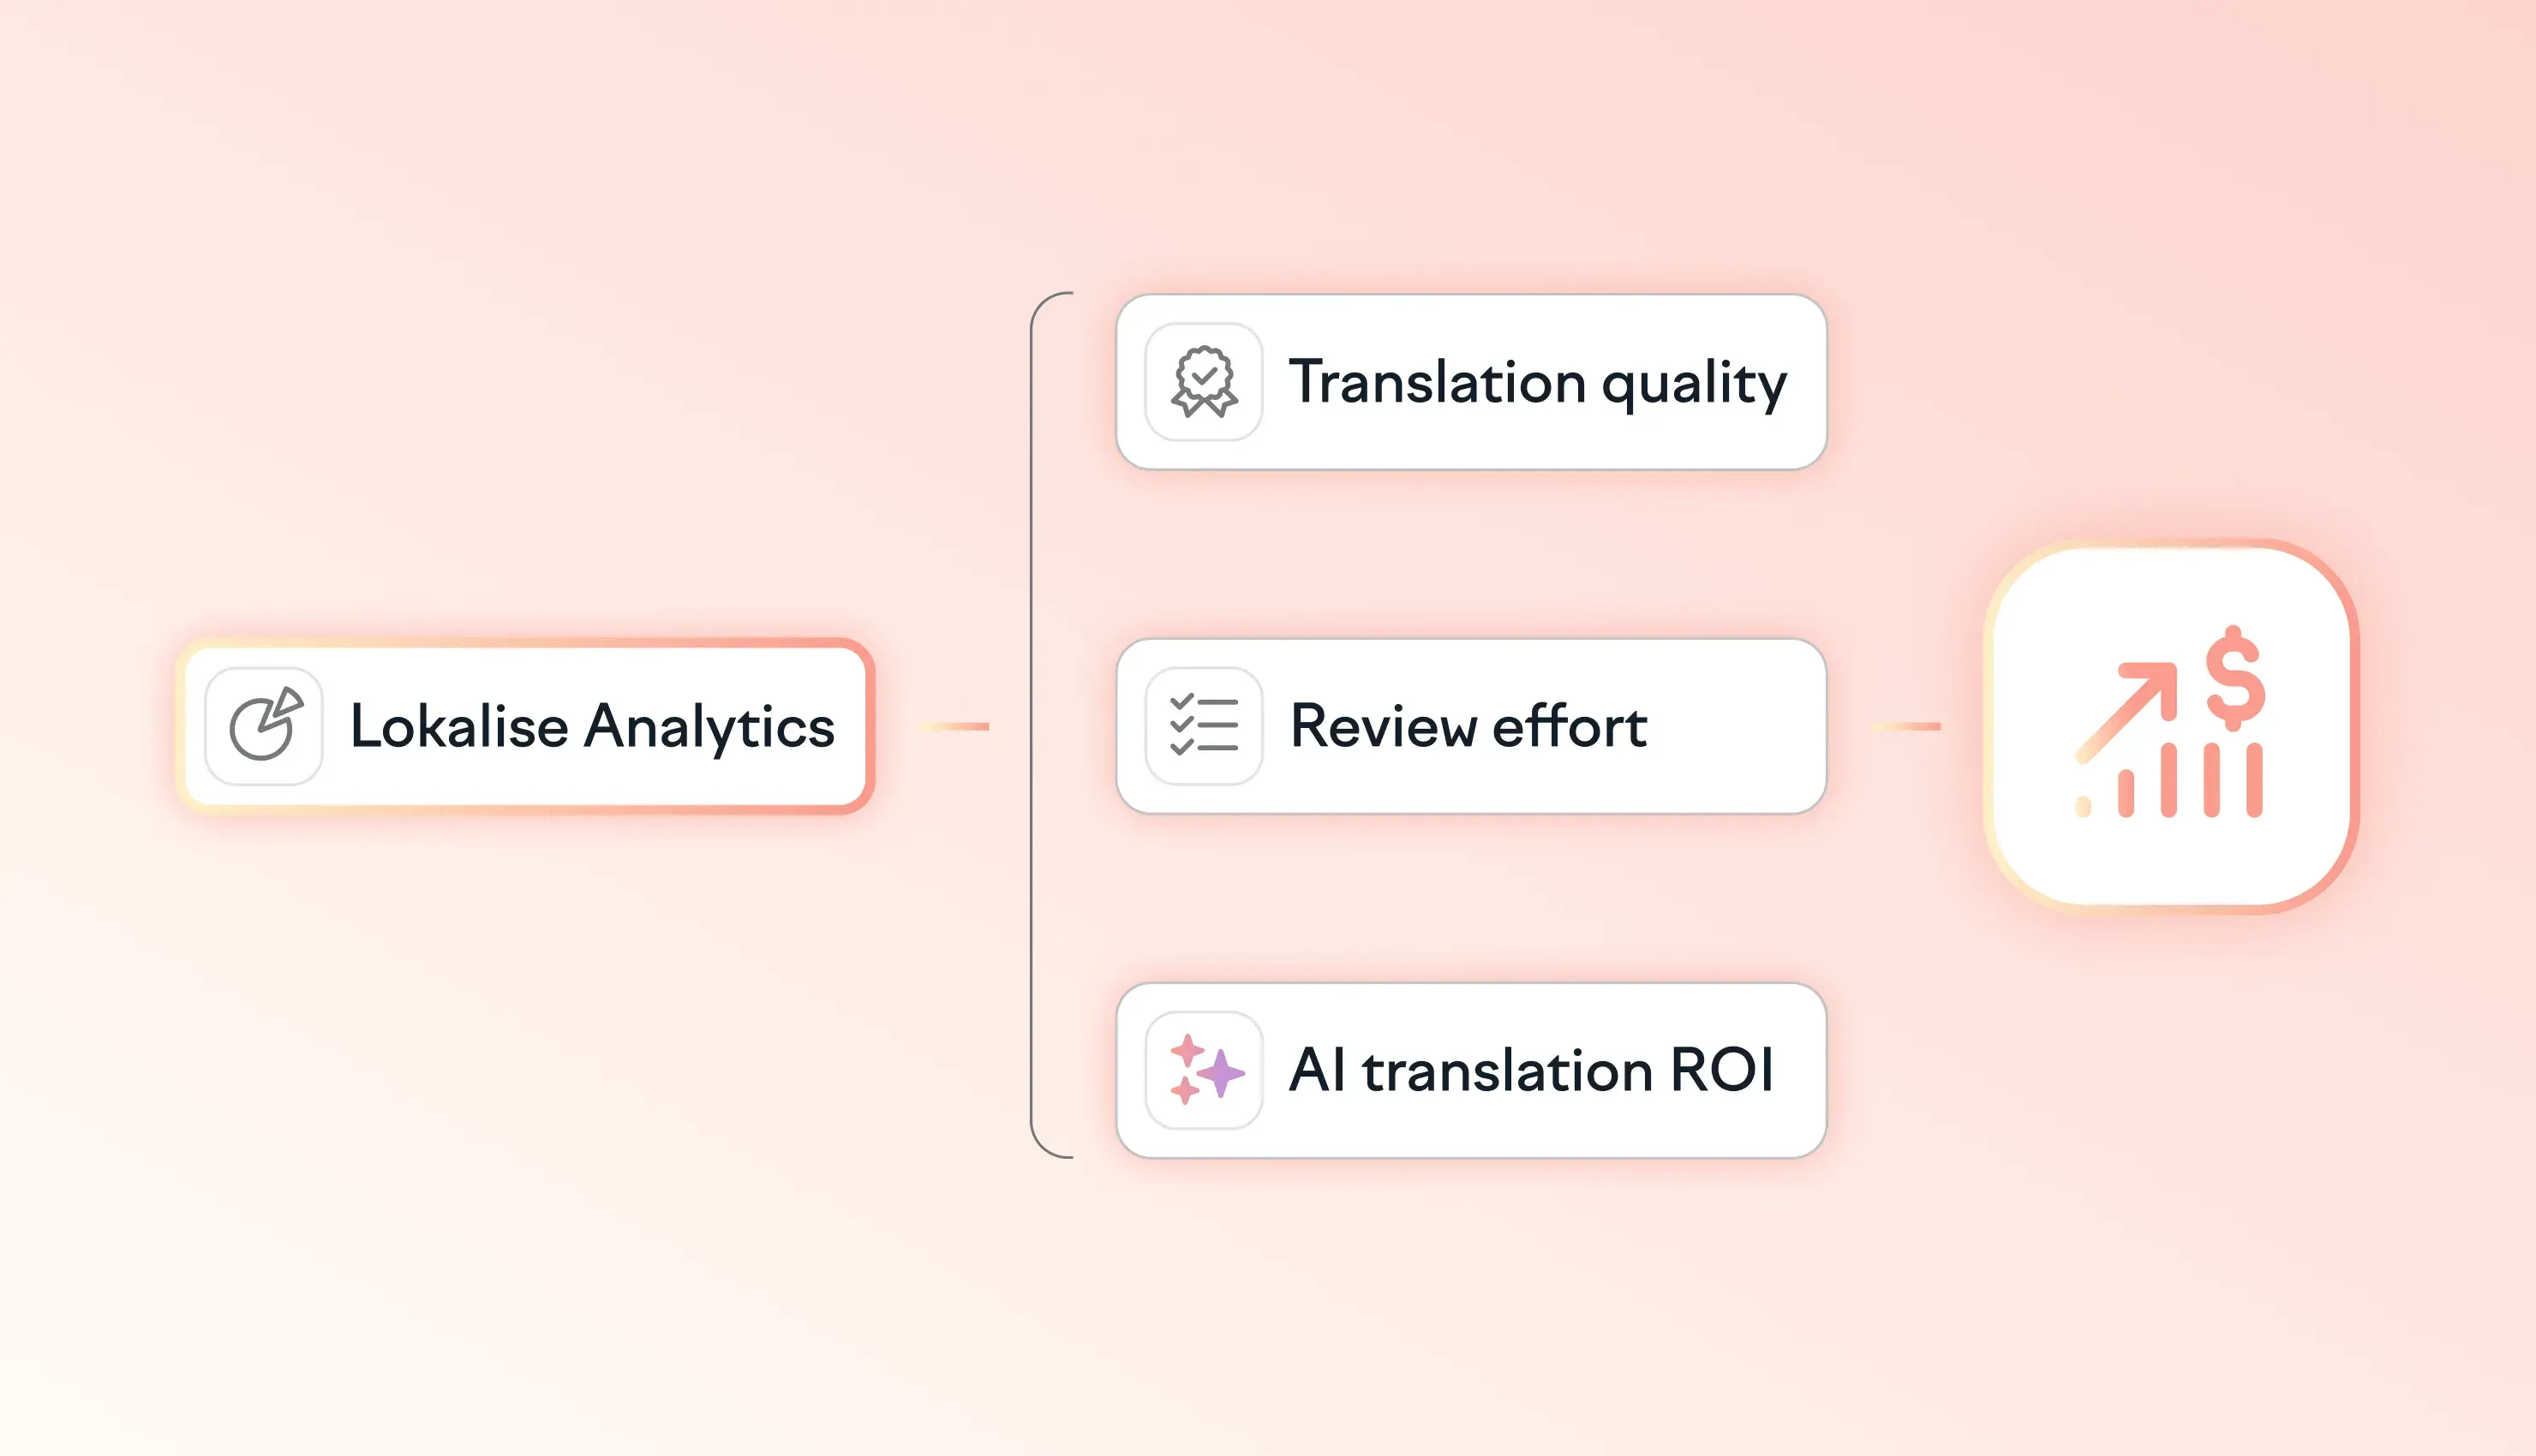
Localization analytics is essential for reporting on return on investment and improving efficiency. Without reliable data, localization risks being perceived as a cost alone. Budgets are harder to defend, and teams investing in AI translation struggle to show the impact on time, quality, and savings.
Analytics brings three core benefits, each connected to the bottom line:
- Report on time saved by shifting work to AI. Analytics breaks down how much content AI and machine translation handle compared with people, helping teams track how their translation mix changes over time.
- Identify opportunities for efficiency. Workflows that consistently need heavy editing show what to improve upstream, from context to glossaries. This raises the quality of future releases and reduces rework.
- Understand where humans add the most value. Not all content needs the same level of scrutiny. AI translation in Lokalise helps teams automate more work, while Analytics shows which languages and content types need closer attention so reviewer time goes where it changes the outcome.
This turns localization from a line item into a growth investment leaders can defend. For a broader business-case framework, see how to calculate and communicate localization ROI.
The localization metrics to track
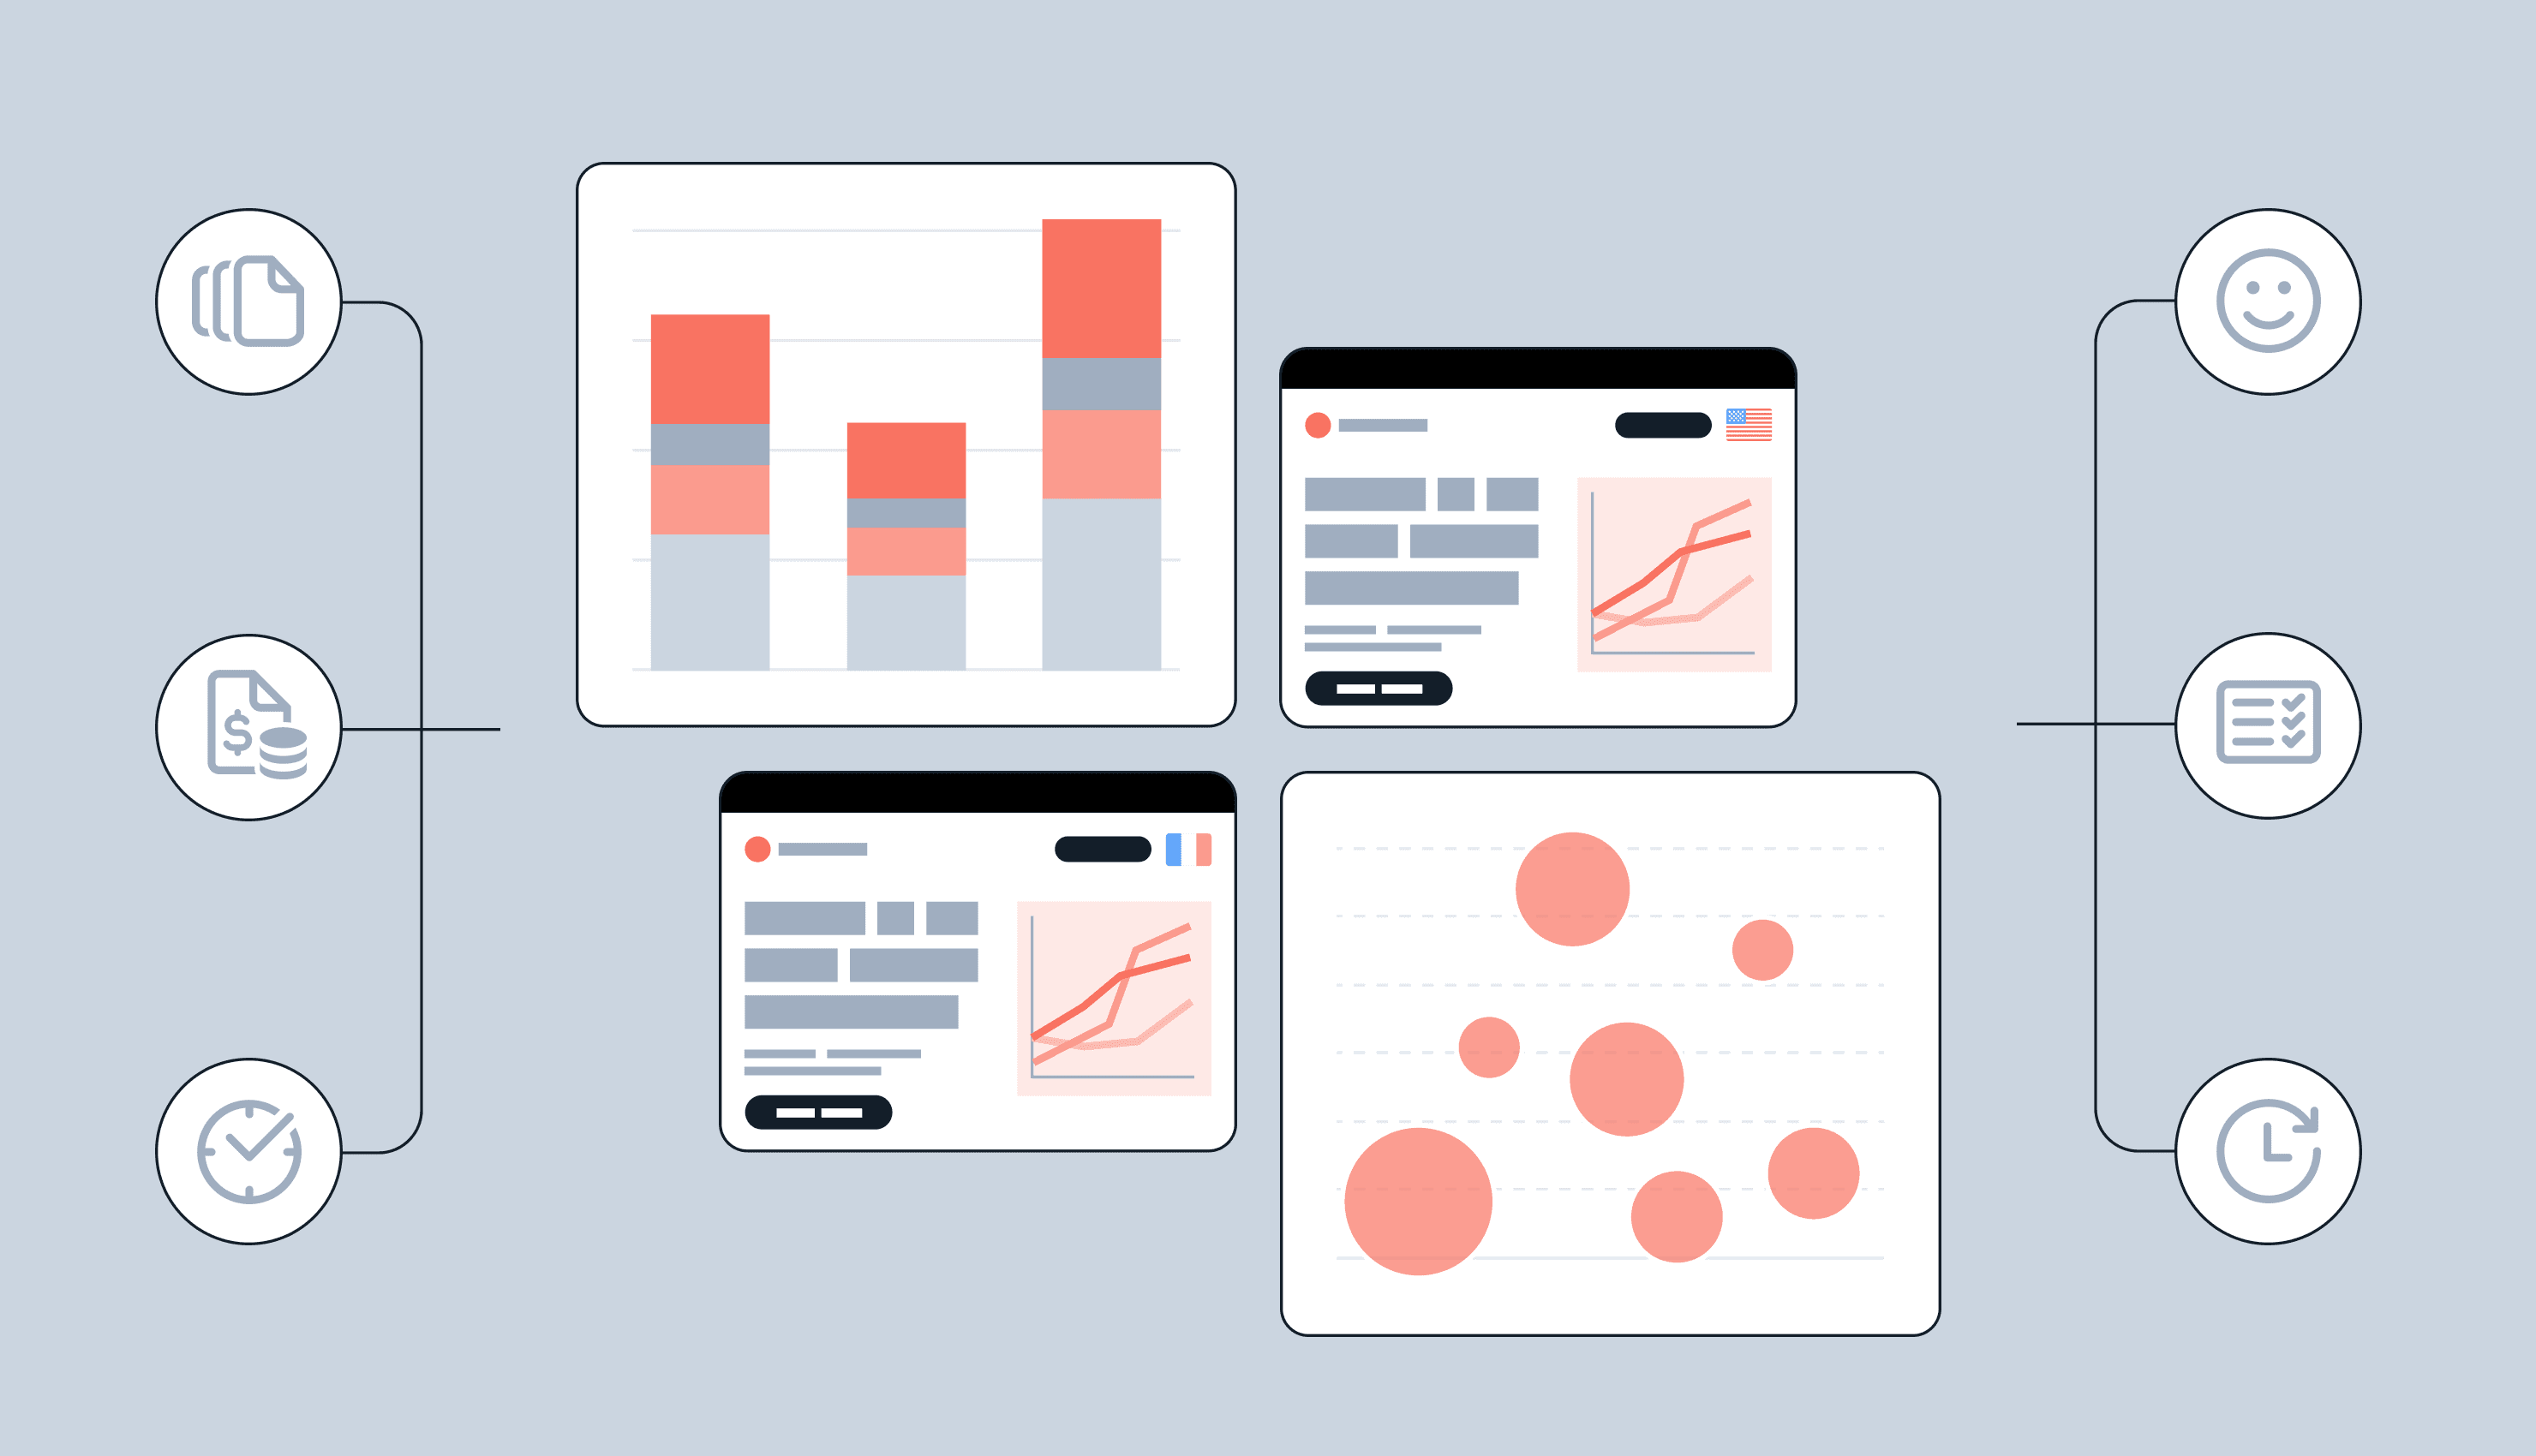
Localization metrics show how much content a program produces, how efficiently work moves, and how good the output is when it reaches customers. The main areas to monitor are:
- Usage: Processed words, translation volume, translation memory leverage, and over-the-air activity reveal how much content is being localized and which methods are being used.
- Task performance: Pending and overdue tasks, task volume, completion rates, completion time, and contributor workload show where work is moving smoothly and where bottlenecks are forming.
- Translation quality: Post-edit rate, average edit distance, review effort, words reviewed, and translations reviewed show how much content needed changing and how substantial those changes were.
- AI Scoring: Score coverage, confidence, flags, issue severity, and language-pair trends help teams compare AI quality signals with actual reviewer behavior.
These metrics complement the wider set of localization metrics that connect operations to business goals.
A translation quality dashboard built around review effort
The Translation Quality dashboard shows how much effort it takes to produce high-quality translations. Teams can compare results across workflows, languages, translators, reviewers, projects, tasks, and translation methods.
See where editing effort goes
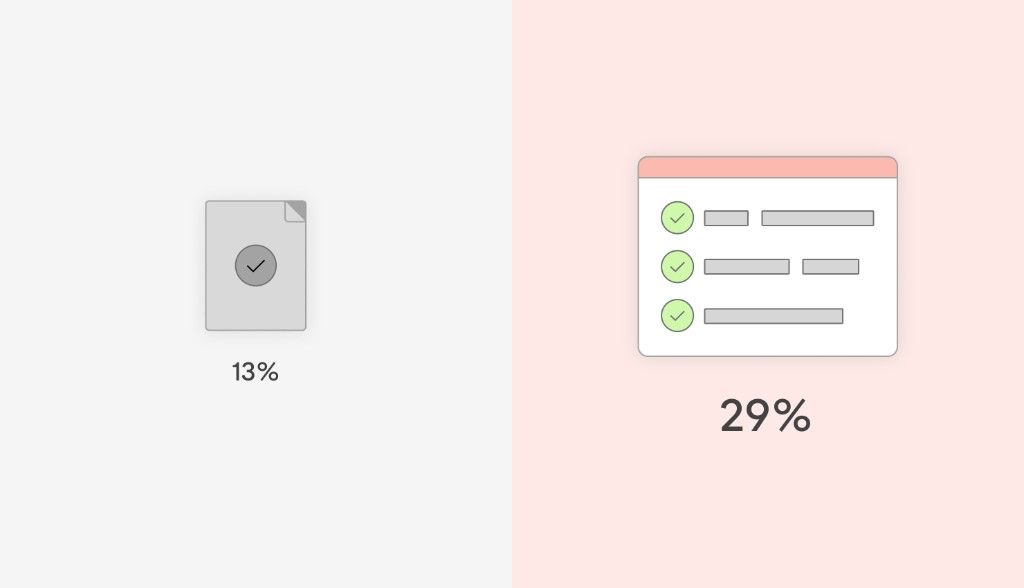
Several metrics reveal how much work a translation required. Post-edit rate shows the share of reviewed translations that a reviewer changed. Average edit distance shows how far the text moved, separating a minor correction from a substantial rewrite. Review effort then groups reviewed content by the amount of editing required. Quality trends plot these metrics over time so teams can see whether their improvements are working.
Identify which languages need attention
Translation quality often varies by language pair. A higher post-edit rate or edit distance can point to a language, workflow, or translation method that needs attention. Contributor-level reporting adds context so teams can distinguish language-specific patterns from differences in review behavior.
Trace quality issues to their source
Budget, deadlines, and accountability often sit at project level. Project and task detail reports make it possible to determine whether a quality issue affects the entire program or is contained within a particular workflow, language pair, contributor, or task.
AI Scoring is included in Analytics, allowing teams to compare model confidence and detected issues with post-edit rates, edit distance, and actual review activity. The Translation Quality dashboard documentation explains the available reports and metrics in more detail.
Usage analytics shows what happens after publishing
Localization measurement often stops when content is published. For mobile and app teams, that leaves out whether translated content reached the device and how much of it customers downloaded.
Over-the-air data is available in Analytics alongside processed words, translation methods, users, and translation memory leverage. Teams can monitor traffic and downloads by platform and review project-level usage in one place.
Task analytics makes bottlenecks visible
The Tasks dashboard shows pending and overdue work, task volume, completion time, workload, and contributor activity across projects. Teams can compare performance by language, project, contributor, and task size, then use task detail reports to investigate slowdowns.
It also includes translation memory coverage at task creation, helping teams estimate how much content could be covered by existing translation memory before work begins. See the Tasks dashboard guide for a full breakdown.
Filters built for how teams report
Shared filters make it easier to move between analytics dashboards without rebuilding the same view. Teams can start with a summary number, then narrow the results by date, language, project, translation method, task type, contributor, or other available dimensions.
Configured views can be shared by URL, allowing a colleague or stakeholder to open the relevant slice of data without recreating the filters. This is useful for recurring program reviews, vendor conversations, and leadership reporting.
Lokalise Analytics is out of beta and available on all paid plans. Dashboards update every 24 hours, making them suitable for weekly, monthly, and quarterly program reviews.
Teams can use one workspace to assess translation quality, understand review effort, monitor usage and tasks, compare AI quality signals with reviewer behavior, and share evidence of progress with leadership.
Localization has always produced evidence of its own value. Analytics makes that evidence easier to find, understand, and act on.